| Wonderstar AnalyticsSee all entries in this blog |
Match Analytics Part 2: Possession Types (08/03/2014 04:16) |
"It's not the size that counts, it's what you do with it." - Sniggering teenage boys everywhere
Long post today, with lots of graphs, so grab a coffee! In the previous two posts, we took a slightly more sophisticated look at match performance by separating possession from conversion rate. In doing so, we discovered that more possession doesn't always mean more goals in the ManagerLeague sim - switching tactics this season gave me reduced possession but more goals, and decreasing fitness during a match seems to reduce your ability to score but not the number of possessions you get. So, clearly, all possessions are not created equal. One thing my match analyser does is extract the number of possessions each team gets, as well as the number and time of goals they score. But I also have it set it up to identify the types of possession each passage of play begins with, and whether or not that play ended in a goal. Let me show you what I mean:
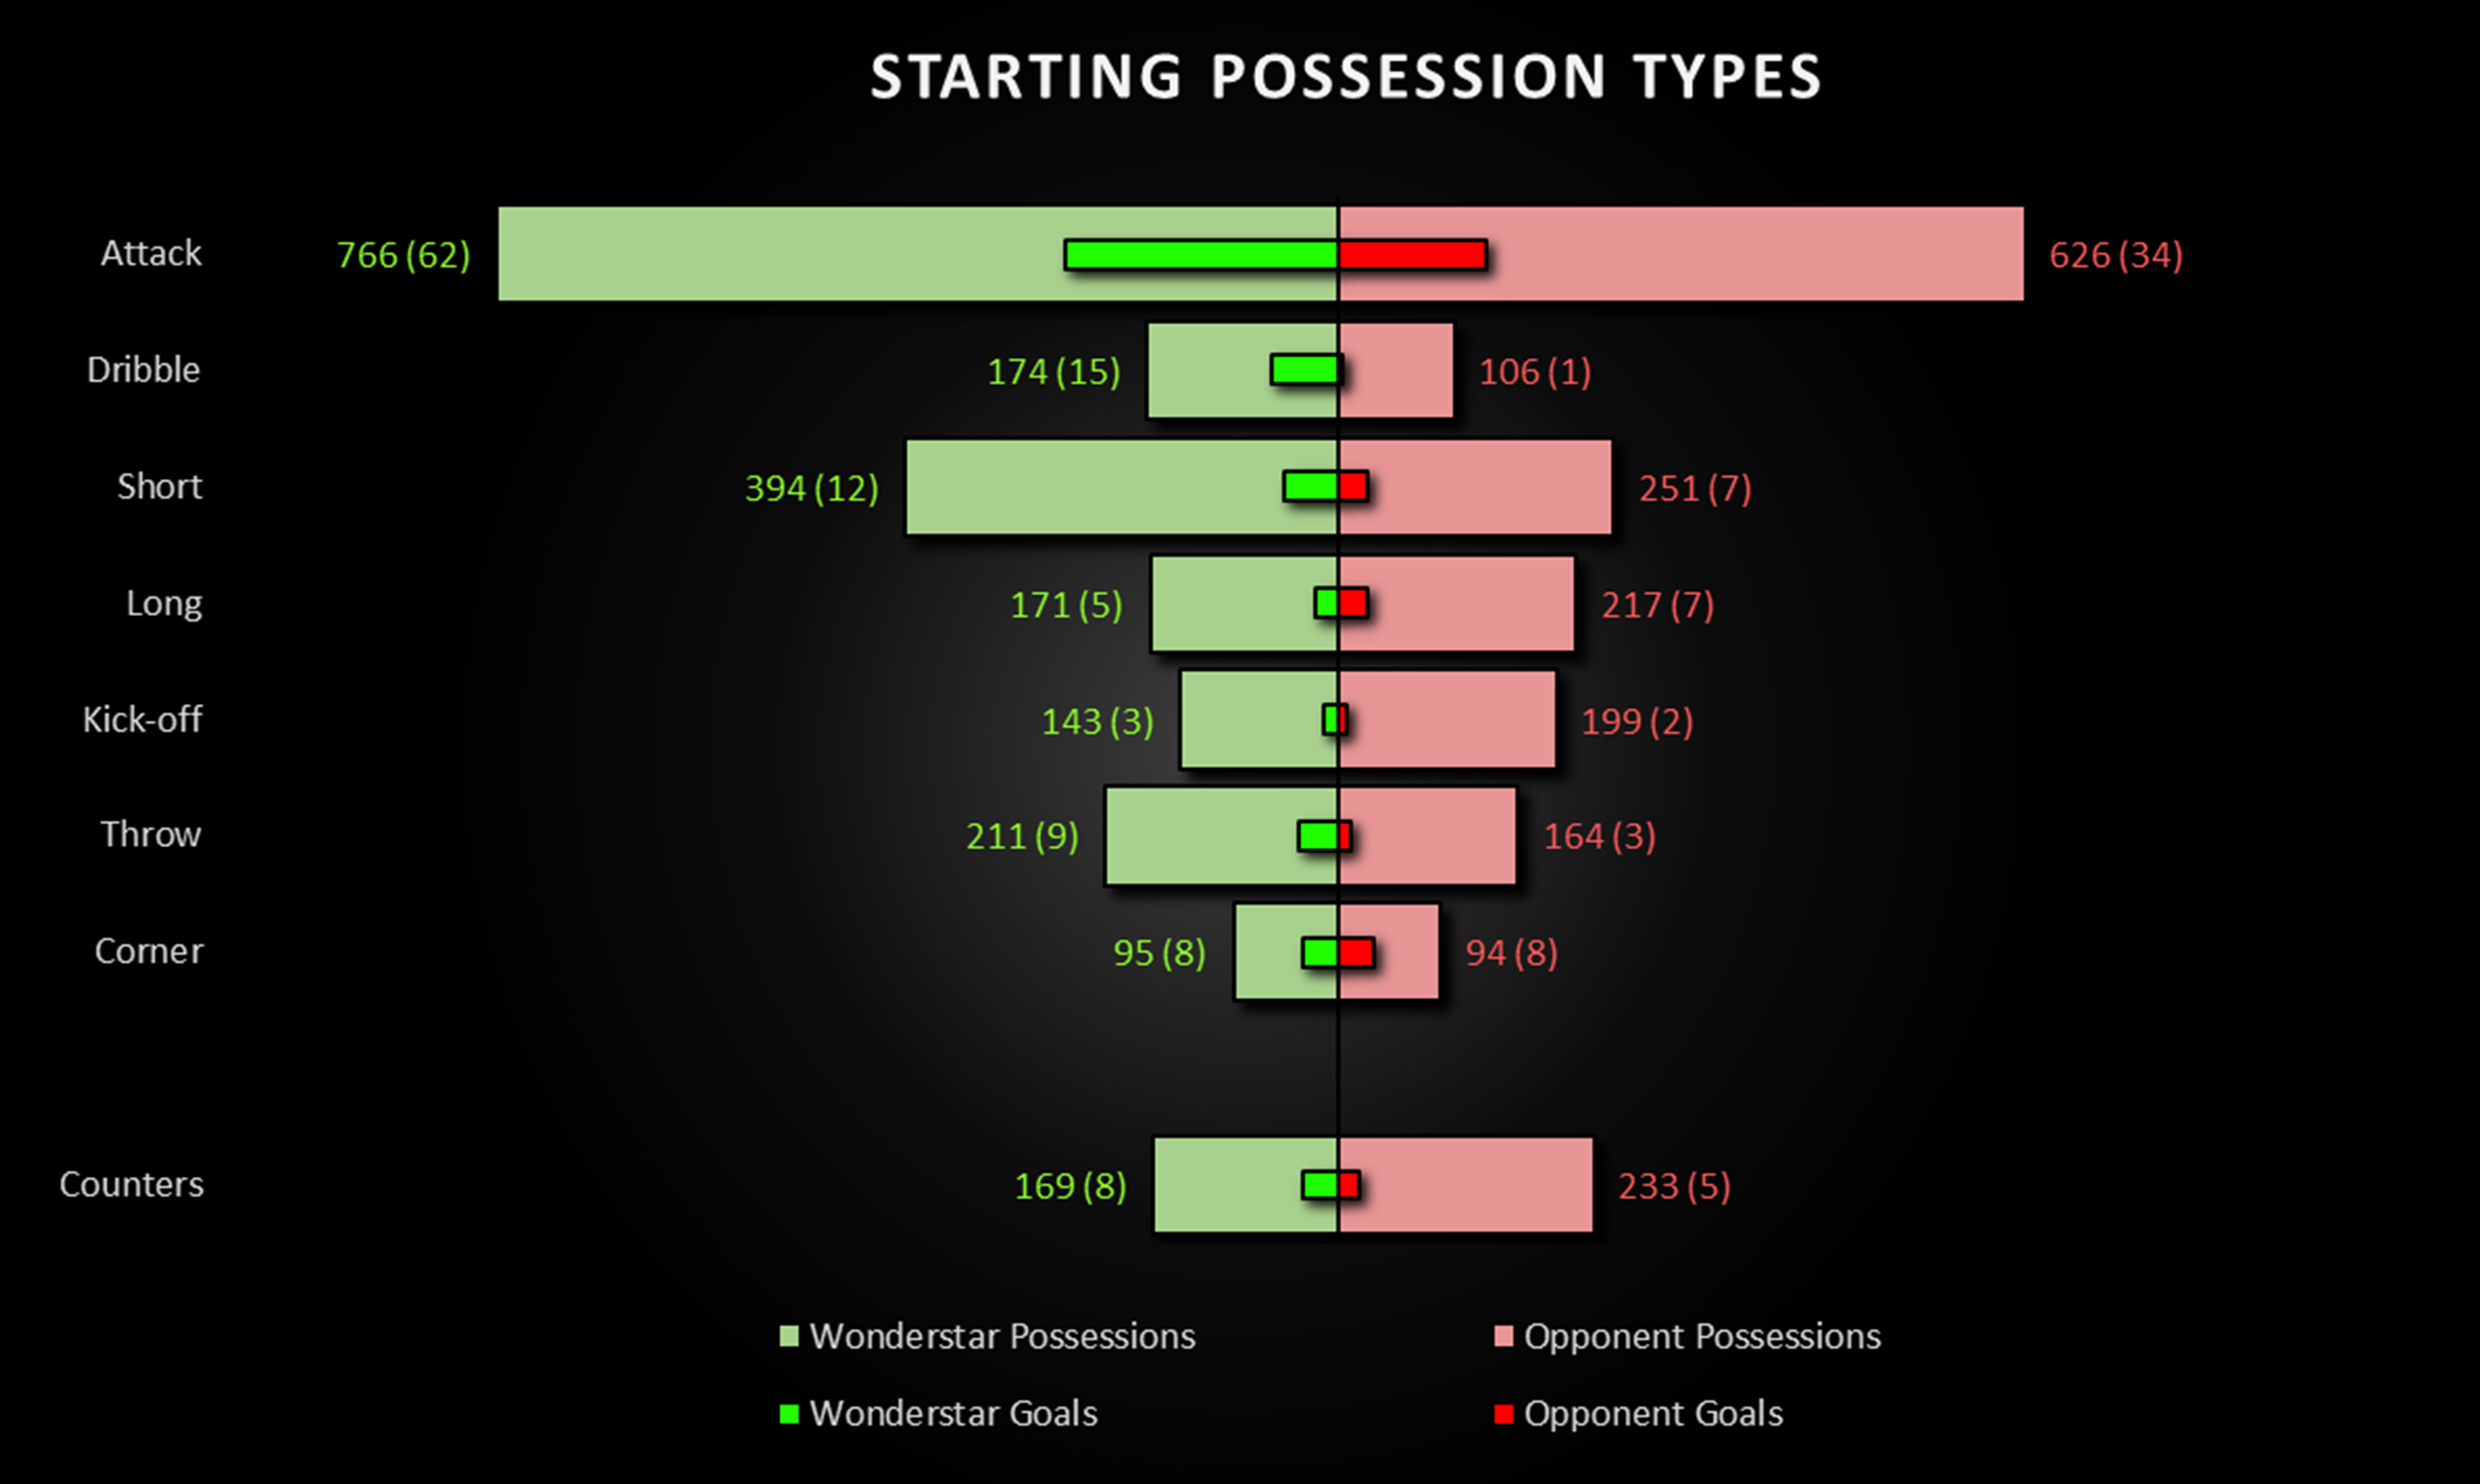
Figure 1: Passages of play sorted by team and possession type for matches involving The Wonderstars, Season 109 (67 matches).
Numbers indicate number of possessions over the whole season, with goals resulting from those possessions in parentheses.
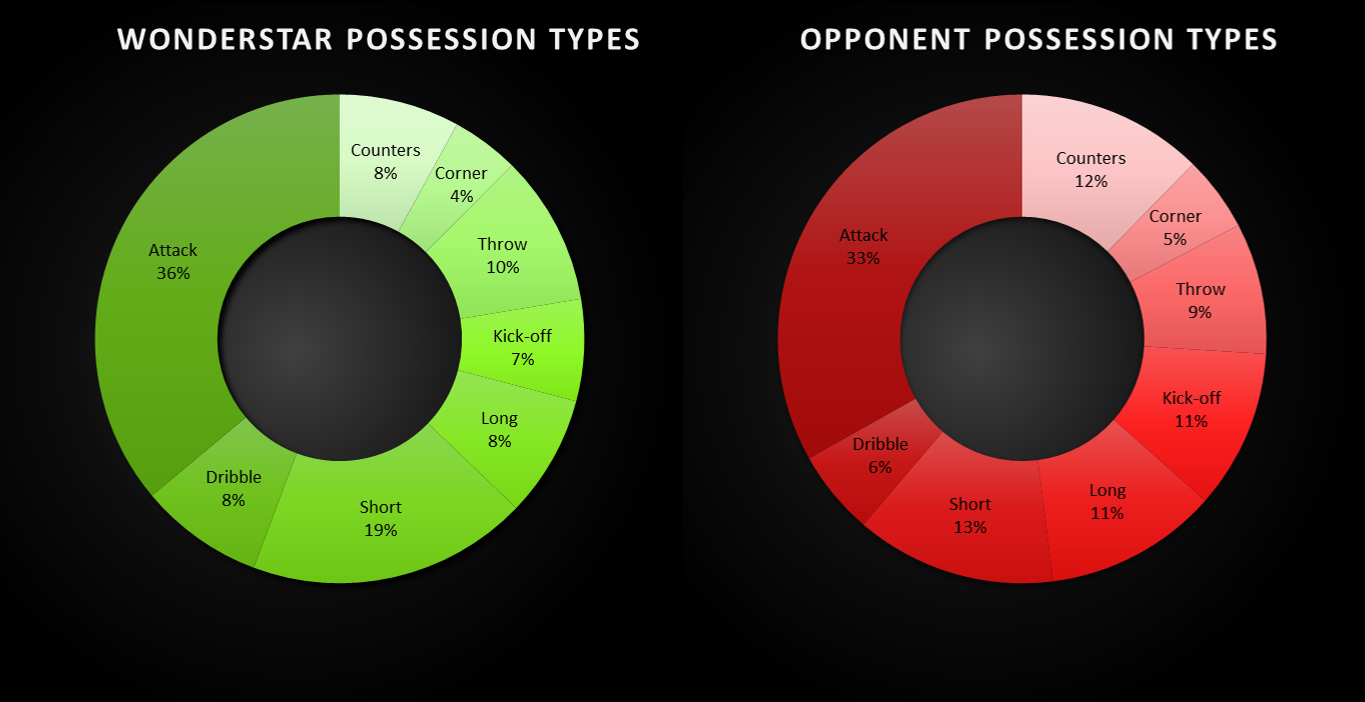
OK, so let's run through what I'm showing you in this graphic. Each time a passage of play begins, one team has the ball, and it will normally be in one of six possible situations: 1. A midfielder in possession in an advanced position (Attack). The text might say something like: "Charles van der Elst is in a good position to cross it now." 2. A player taking on and trying to run past the opposition (Dribble). The text might say: "Jurgen Hallaert with the ball now, trying to get past Jerome Vargas." 3. A short, simple pass from a defender to another specific player (Short) as the team build up patiently from the back. For example, "Ilie Cristea passes the ball to Mazin al-Hindi". 4. A longer pass, hit by the goalkeeper or a defender towards the midfield (Long): "Mauro Scifo passes the ball towards the midfield". 5. A Throw-in. This is pretty self-explanatory. 6. Ditto for Corners. In addition to these normal possessions, each half begin with a Kick-off. Finally, teams can sometimes win possession midway through a passage of play, either by winning a free-kick or a throw, or by intercepting and Counter-attacking when opponents hit a stray pass or a weak shot. What the graphic above show you is the number of each possession type won by the Wonderstars (large green bars) and their opponents (large red bars) over the whole of Season 109. In the smaller bars we can see how many of these possessions resulted in goals for each team - they're designed so the area of each bar is proportional to the number of possessions or goals, and I've also added the actual numbers next to each bar. So what can we make of this? Well first off, if you read my Introduction to Match Analytics you might remember that Season 109 was a department-winning year for The Wonderstars, and they had 55% of the possession overall - so it's no surprise that you see generally bigger green possession bars than red ones. The distribution is clearly a little different too - The Wonderstars had 55% possession, but definitely more than 55% of the dribbles and short passes. On the other hand they had fewer long balls, counter-attacks and kick-offs than their opponents, while corners and throw-ins were roughly similar for both teams. A pie chart helps us see how reliant each team was on different types of possession:
Figure 2: Reliance on each possession type for The Wonderstars and their opponents, Season 109 (67 matches).
Well, kick-offs are easy to explain: Both sides will get equal numbers except if one team concedes more goals. So that difference is just due to The Wonderstars conceding fewer goals and thus having to kick off less. Counter-attacks is probably because The Wonderstars didn't often play with counter-attacks or offside traps, whereas some of their opponents did (resulting in more quick breaks and free kicks for offsides). The long ball / short ball distribution also makes sense because The Wonderstars like to think of themselves as a skillful passing side (it's actually because they have low speed, heading and perception but don't tell them that), and play continental style most of the time. Dribbles is quite interesting, but we definitely have a high-flair player or two in our ranks, so it seems that the sim gives them a chance to do their thing more often than players with lower flair. Now let's take a similar look at Season 110, in which The Wonderstars got pretty much battered in a higher division, but still managed roughly 50% possession:
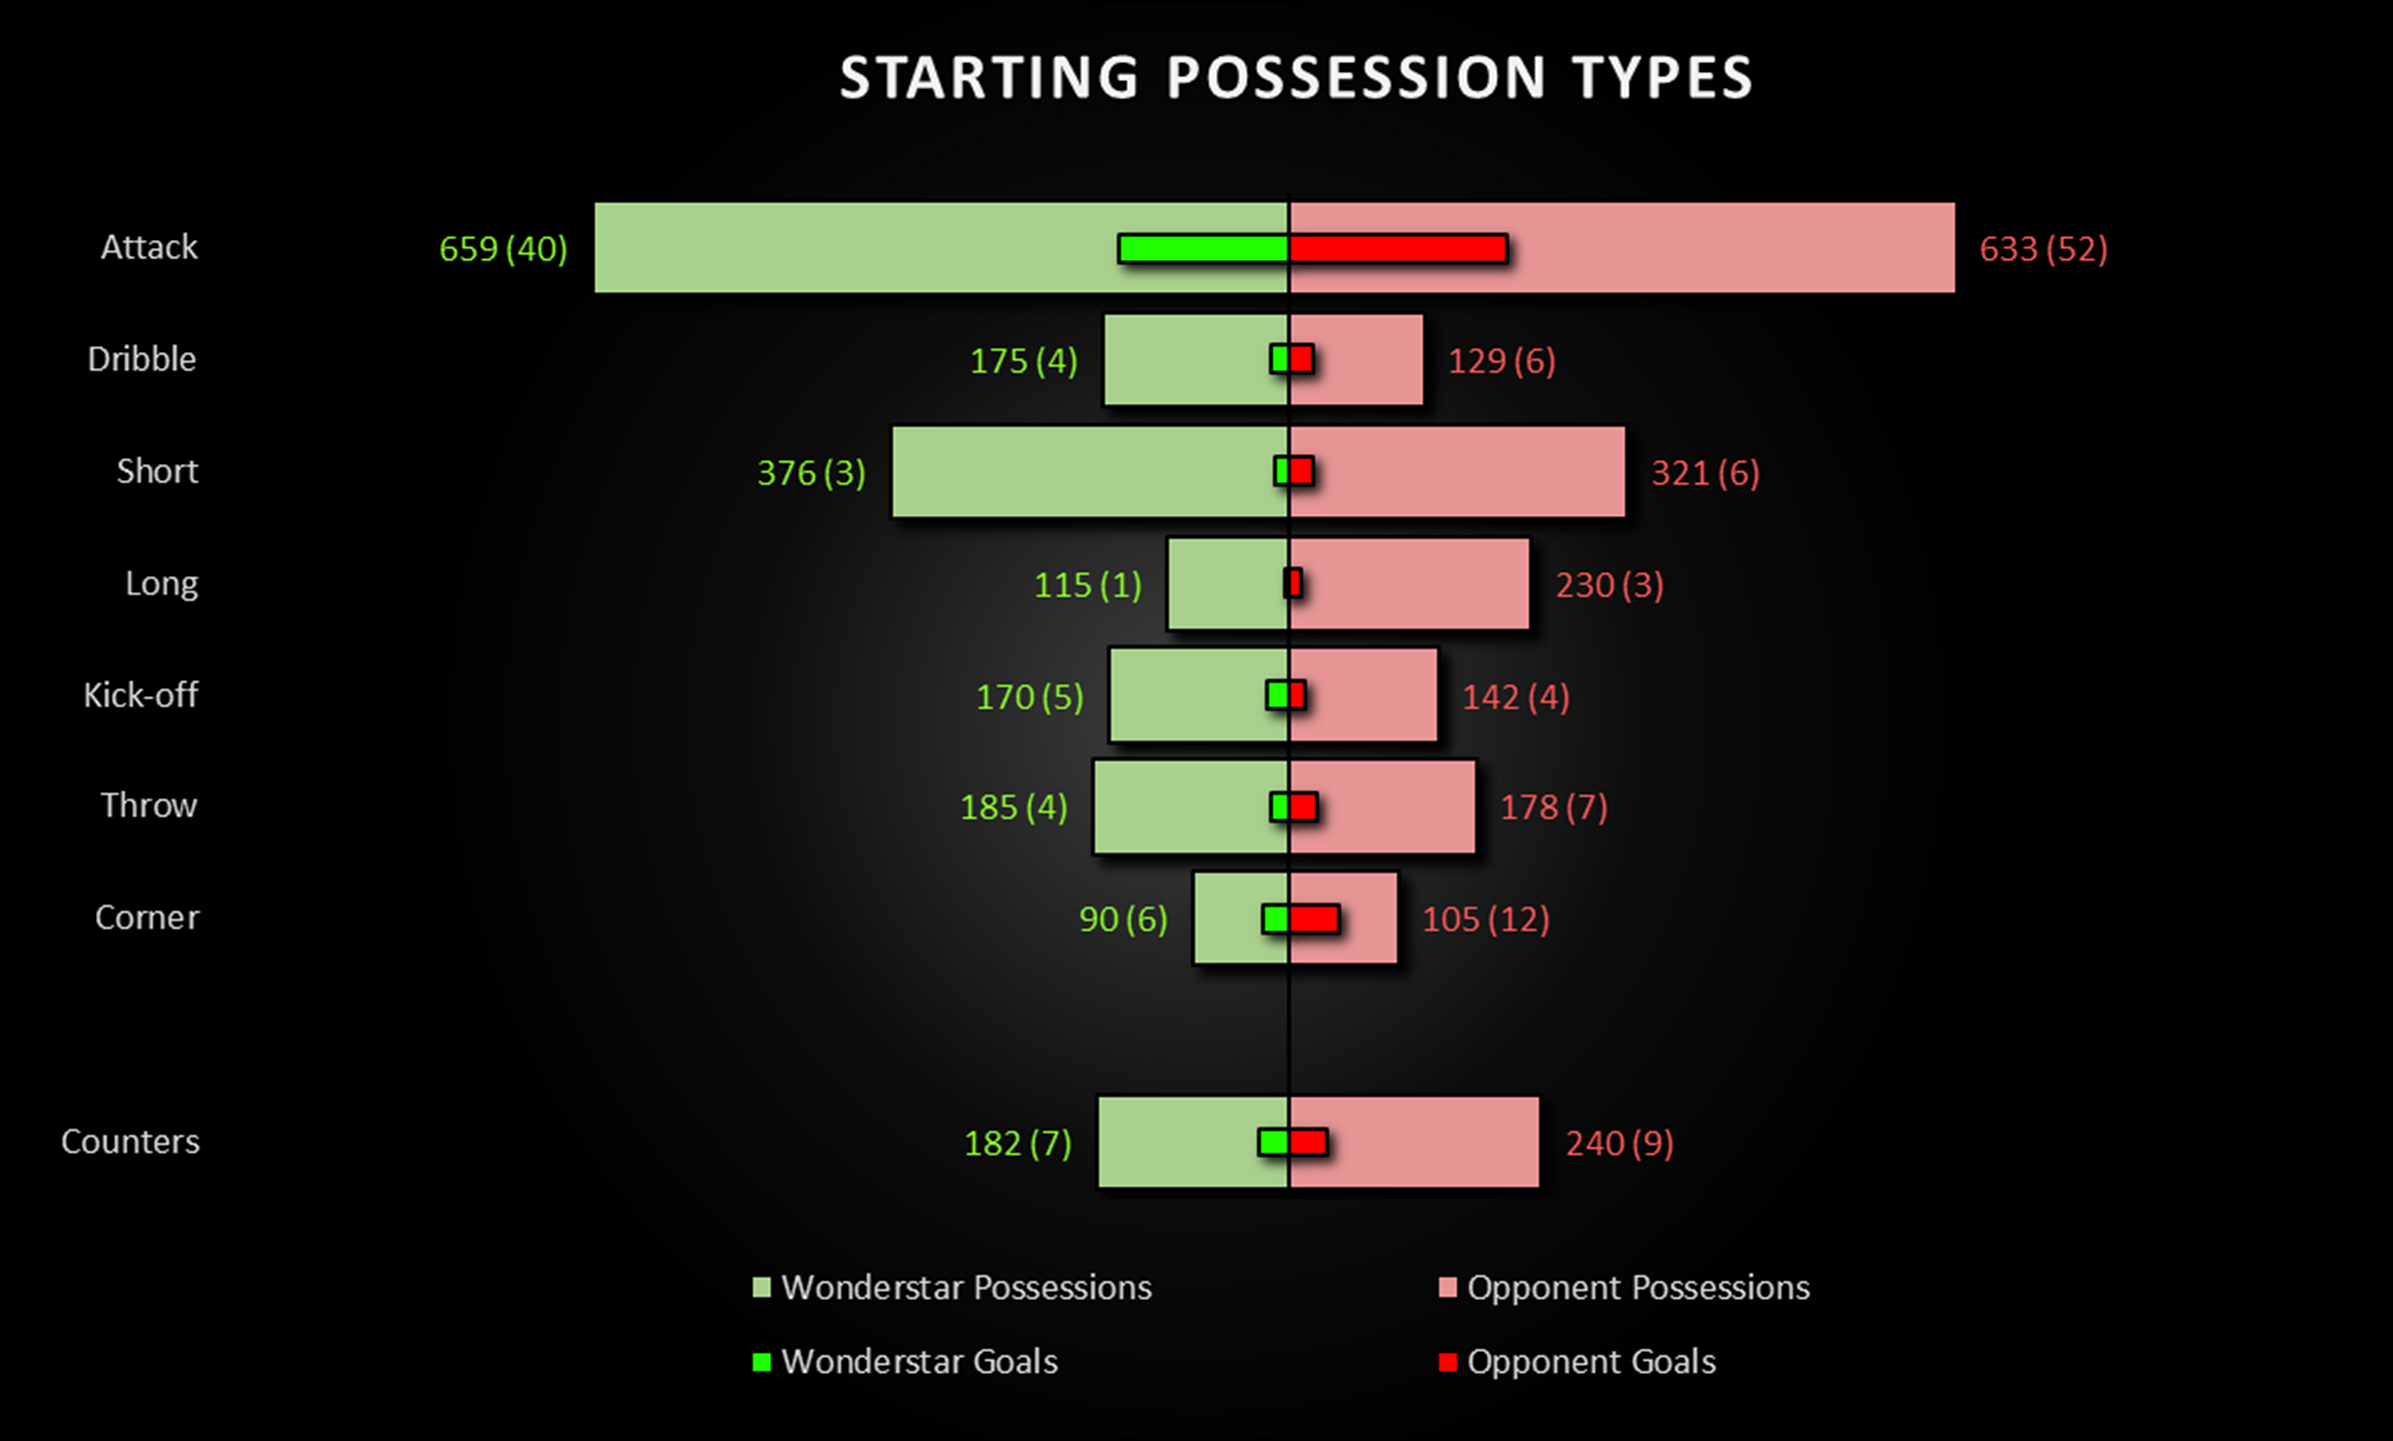
Figure 3: Passages of play sorted by team and possession type for matches involving The Wonderstars, Season 110 (66 matches).
Numbers indicate number of possessions over the whole season, with goals resulting from those possessions in parentheses.
As possession was roughly equal, the larger bars show relatively little difference between the two sides. There's still some differences in how possession types are distributed, which are similar to the previous season: The Wonderstars were still building up from the back with short passes much more often than they were playing the long ball, and they also dribbled more frequently but were less likely to turn their opponents over and counter-attack. The problem for the Wonderstars was that they just didn't convert as many of those possessions into goals. In particular, you can see that despite similar numbers of possessions, The Wonderstars scored far less frequently from corners or attacking positions than their opponents, and in almost 500 possessions starting in defence - Short & Long in Figure 3 - managed a pitiful 4 goals. So let's take a look at this in more detail.
Strengths and Weaknesses For every possession type, I calculated the conversion rate - so to get The Wonderstars' conversion rate for kick-offs for example, I divided the number of goals (5) by the number of kick-offs (170) the Wonderstars got. But I didn't just look at starting possessions - for this analysis I looked at every time The Wonderstars (or their opponents) got into one of those match situations. So if they started with the ball in defence, played it out continental-style to the wings, crossed it in and won a corner, that passage of play includes Short passing, Attack and Corner situations. This way, we can get a measure of how frequently overall the teams scored - whether directly or later in the passage of play - from different match situations. We can ask questions like, "If during a passage of play The Wonderstars were dribbling at their opponents, how often did that ultimately result in a goal?", and answer them with a percentage - basically a conversion rate, but only looking at chances involving that specific match situation. Note that all of these match situations therefore include more chances than just the starting possessions shown in Figures 1-3, with the exception of kick-offs which always occur at the beginning of a passage of play. It also means that the same passage of play - indeed the same goal - can get included in several different categories. Finally, we can also add free-kicks into the mix - although you never get given a free-kick to begin a passage of play, they're quite commonly earned halfway through by drawing a foul, or catching your opponent offside. OK, here we go. Let's go back to that easy promotion year in Season 109:
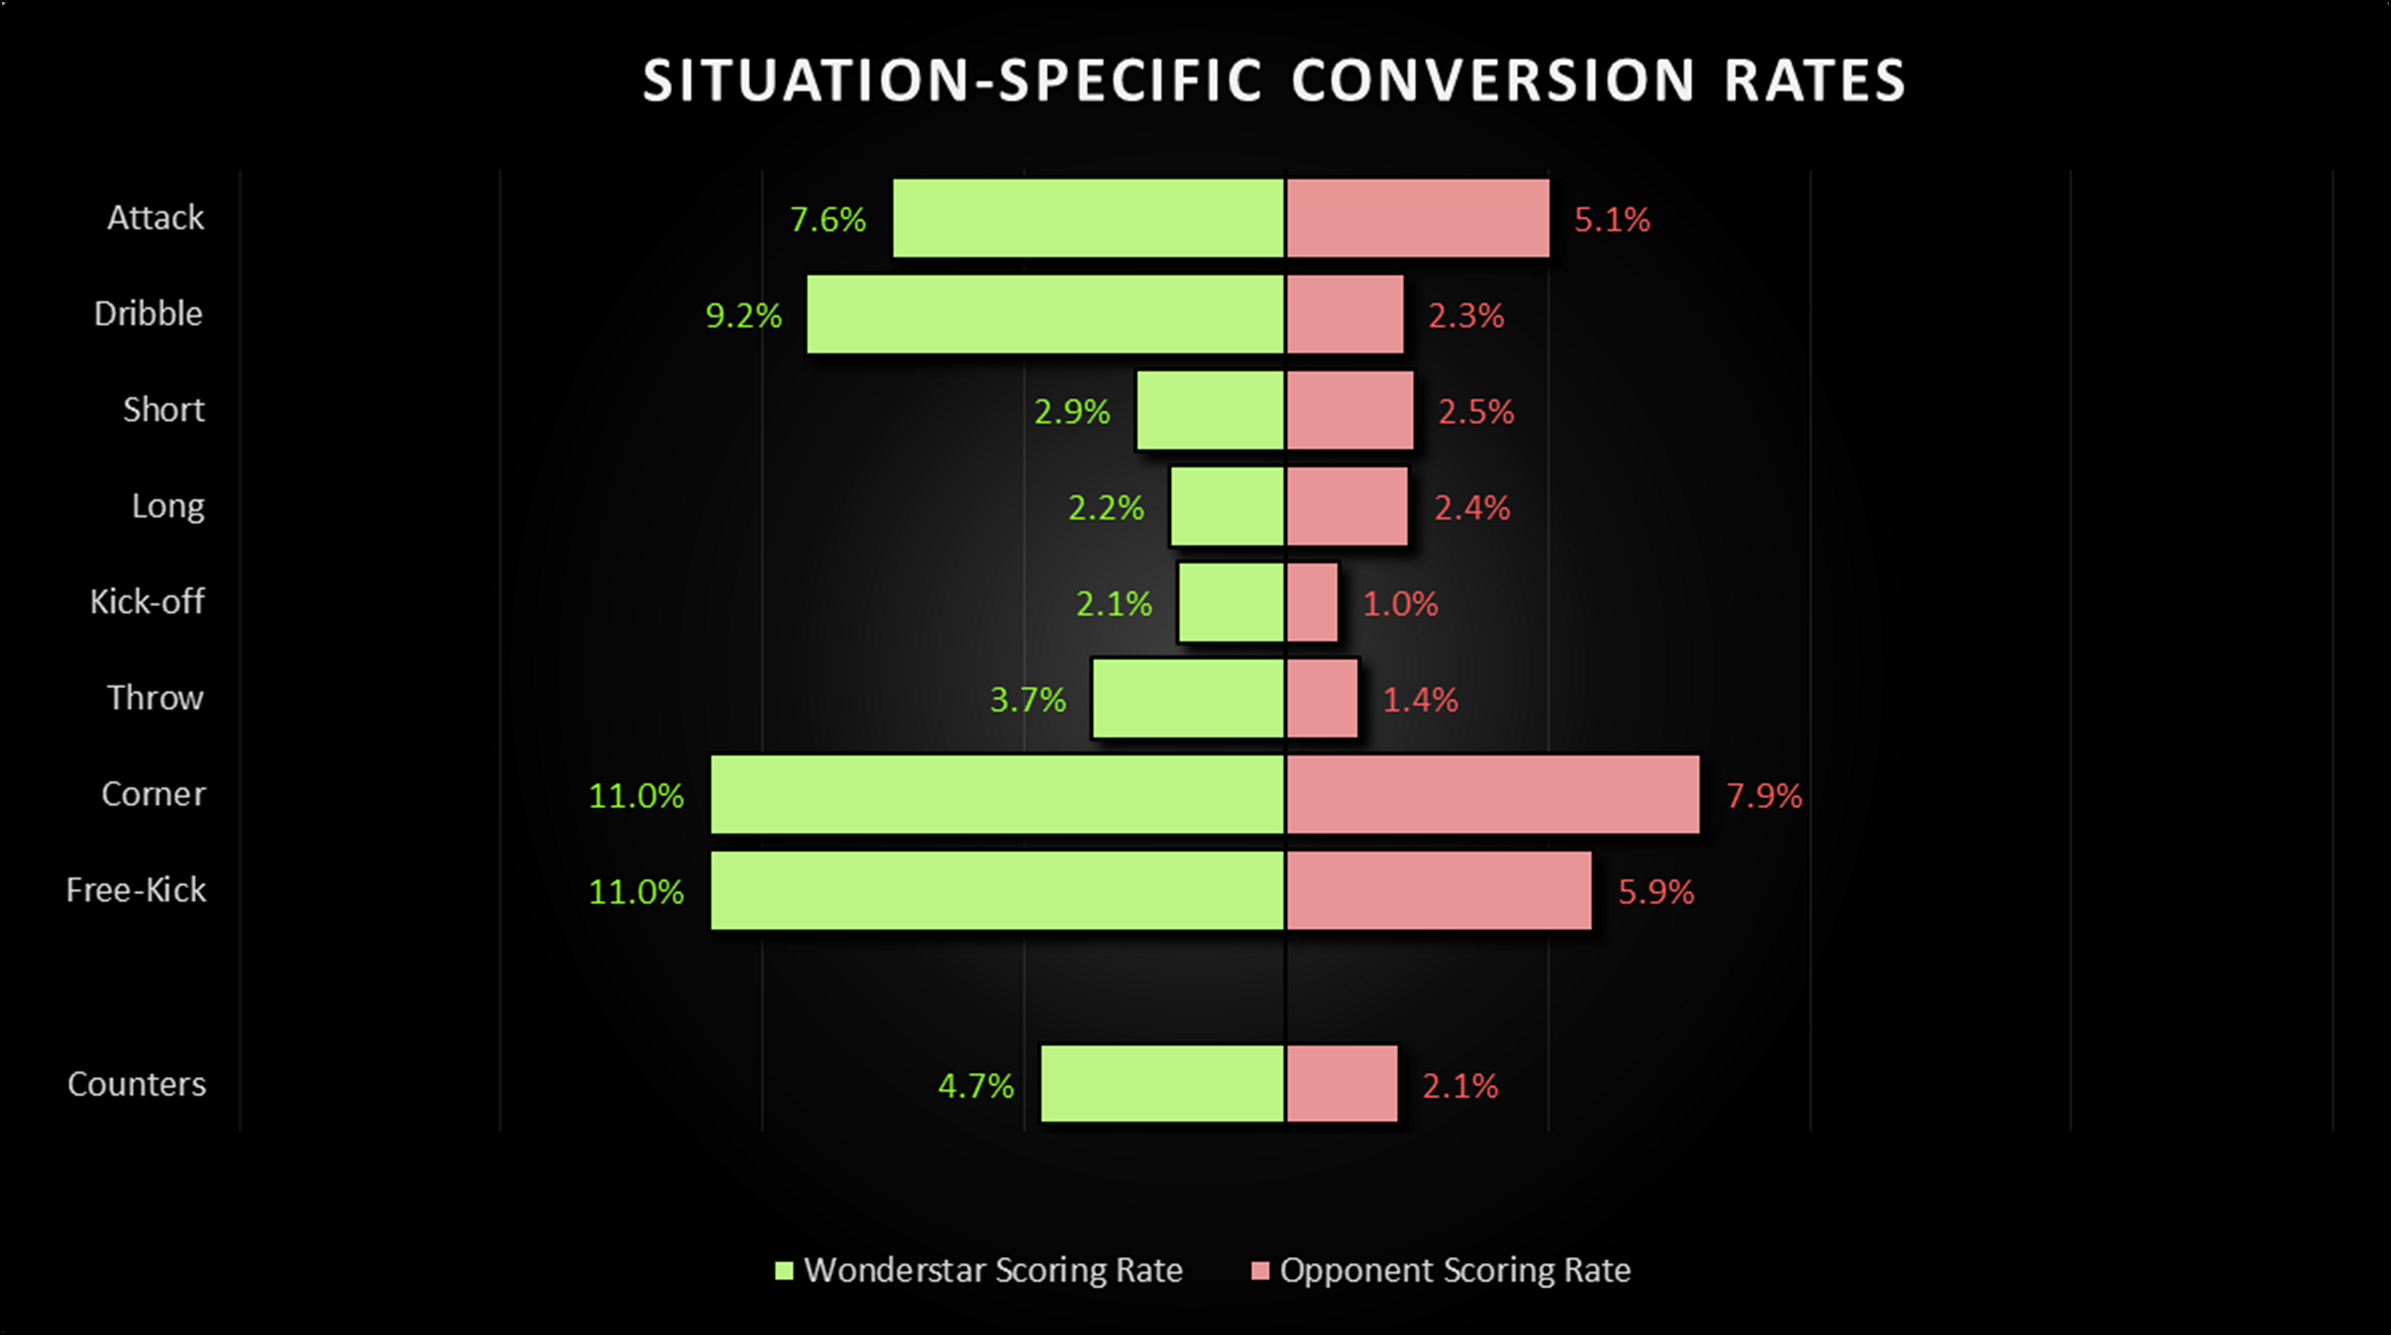
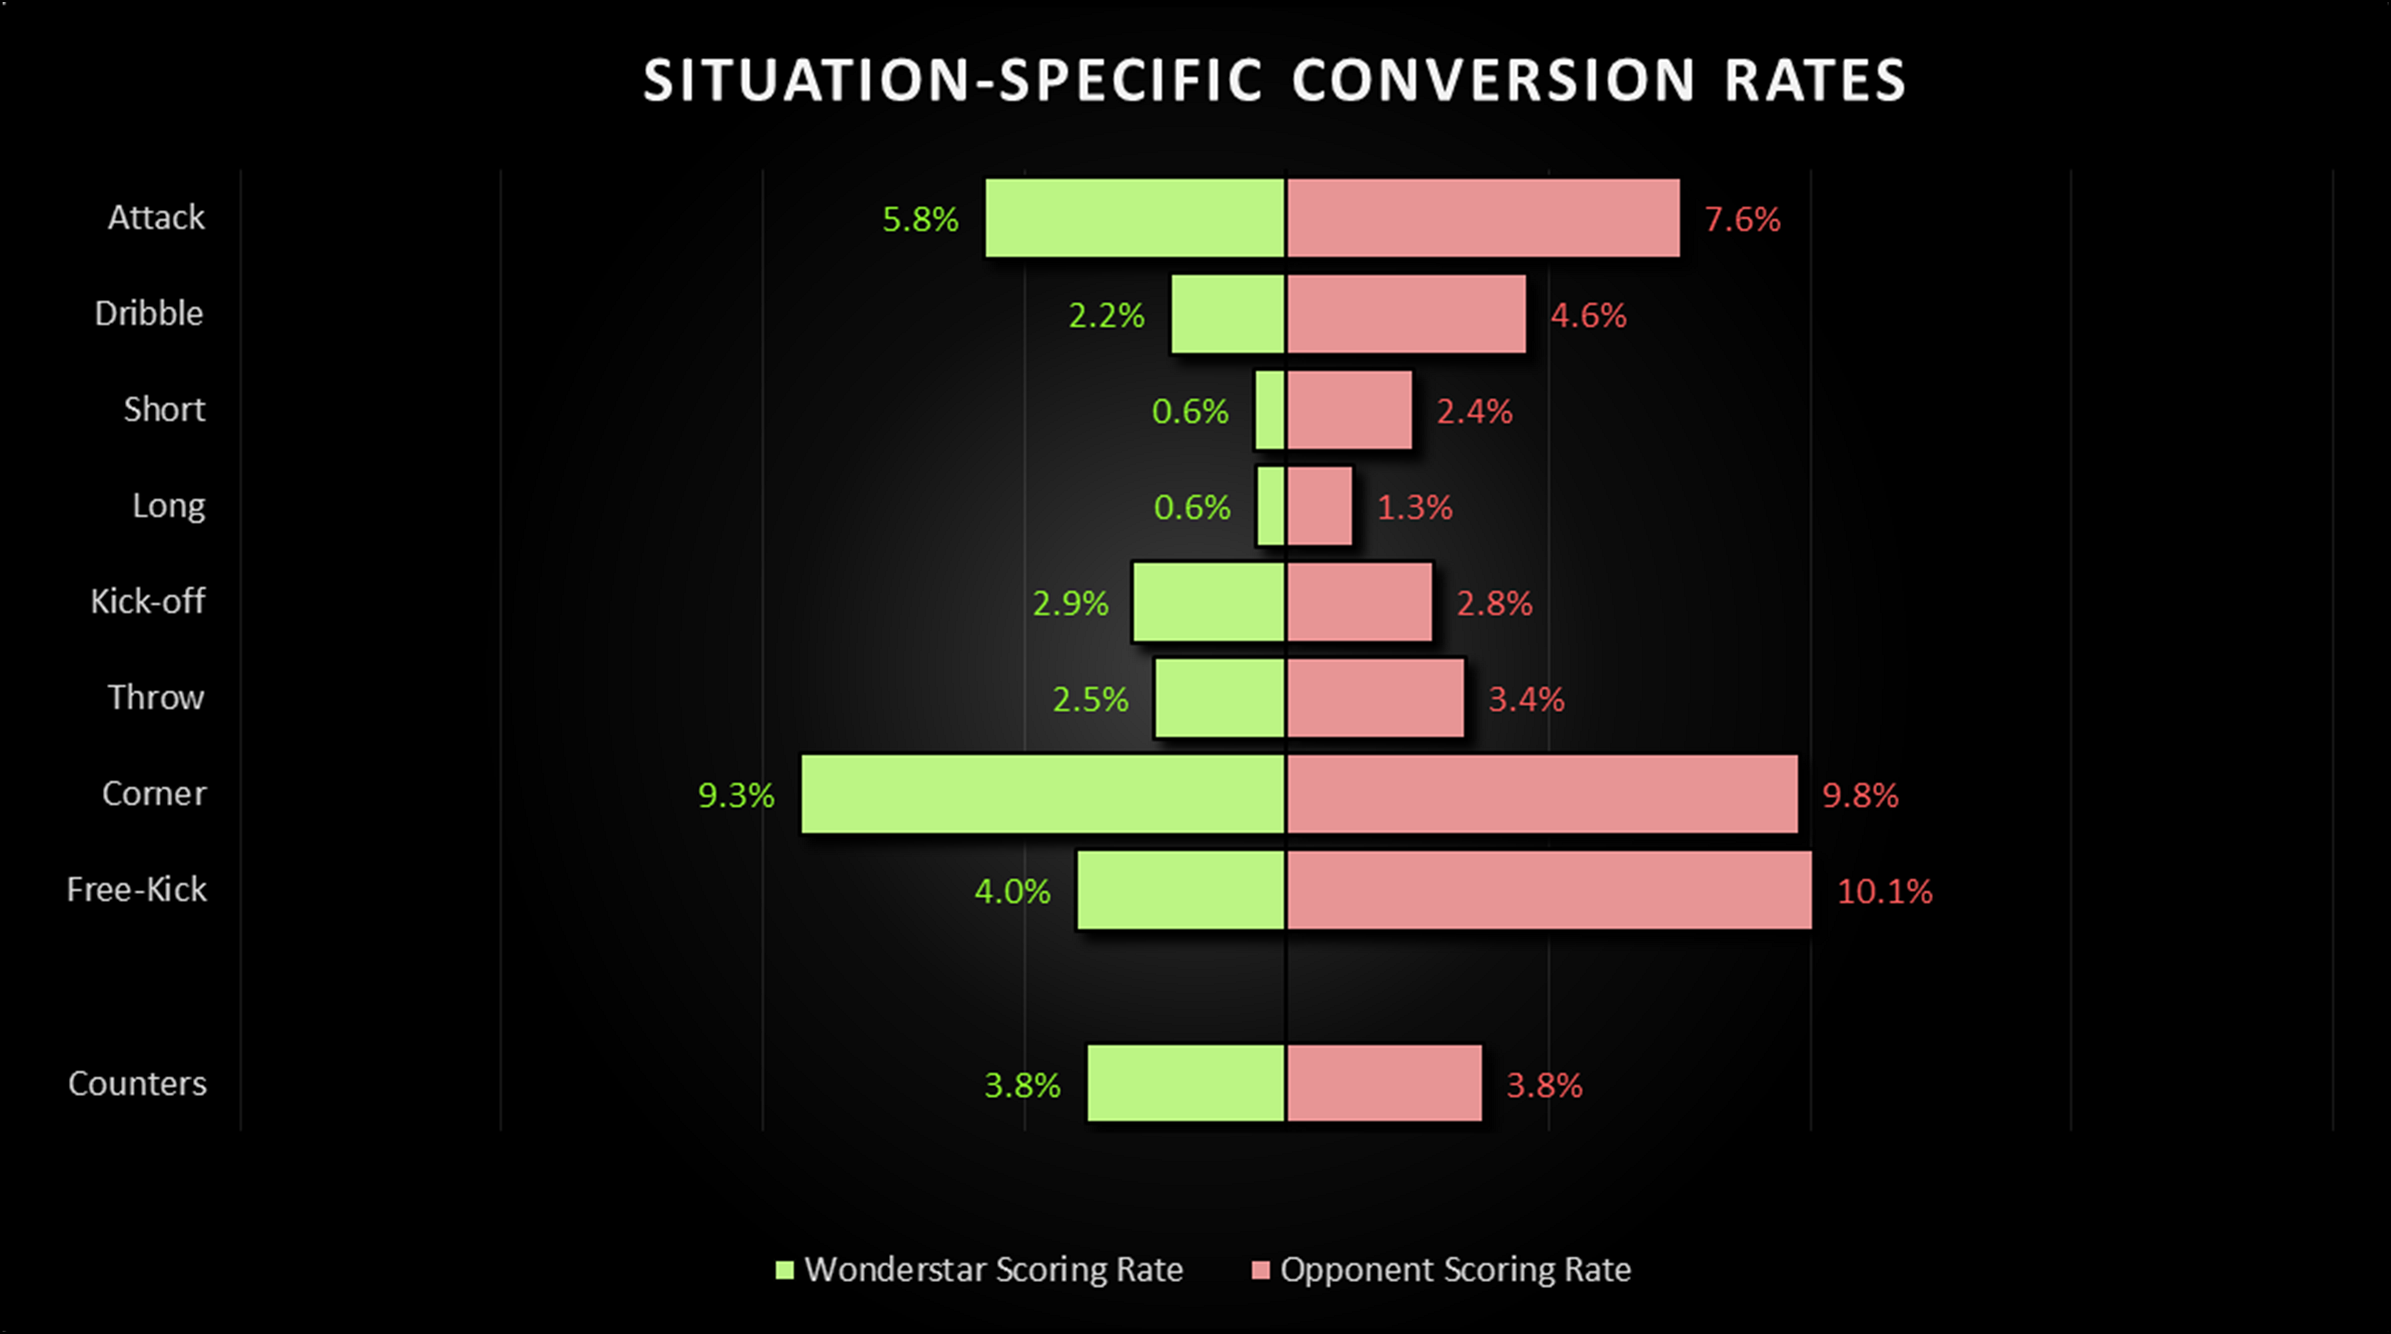
Figure 4: Chance of scoring from different match situations for The Wonderstars and their opponents, Season 109 (67 matches).
Now we can see really clearly why The Wonderstars scored so many goals that season, despite 'only' 55% possession. Recall that overall conversion rates tended to be around 4-7%. Corners and free-kicks ended up in goals at a much higher rate though, a huge 11% of the time for The Wonderstars. The flair players in the team made a big difference too, with over 9% of their efforts resulting in goals, and crosses or passes from midfield were also converted pretty frequently into goals. Interestingly, even though The Wonderstars counter-attacked less frequently than their opponents, they were much more dangerous when they did so - perhaps because several of those counter-attacks would have been defensive free-kicks resulting from offsides or wrestling at corners. On the other hand, The Wonderstars didn't really score any more often than their opponents from defensive positions, regardless of whether they opted for Short or Long passing. Their advantage came from pretty specific situations, mostly set pieces and dribbles. Now lets take a look at what happened when they moved up a division in the following season (110). Remember, possession was pretty even. Conversion was emphatically not:
Figure 5: Chance of scoring from different match situations for The Wonderstars and their opponents, Season 110 (66 matches).
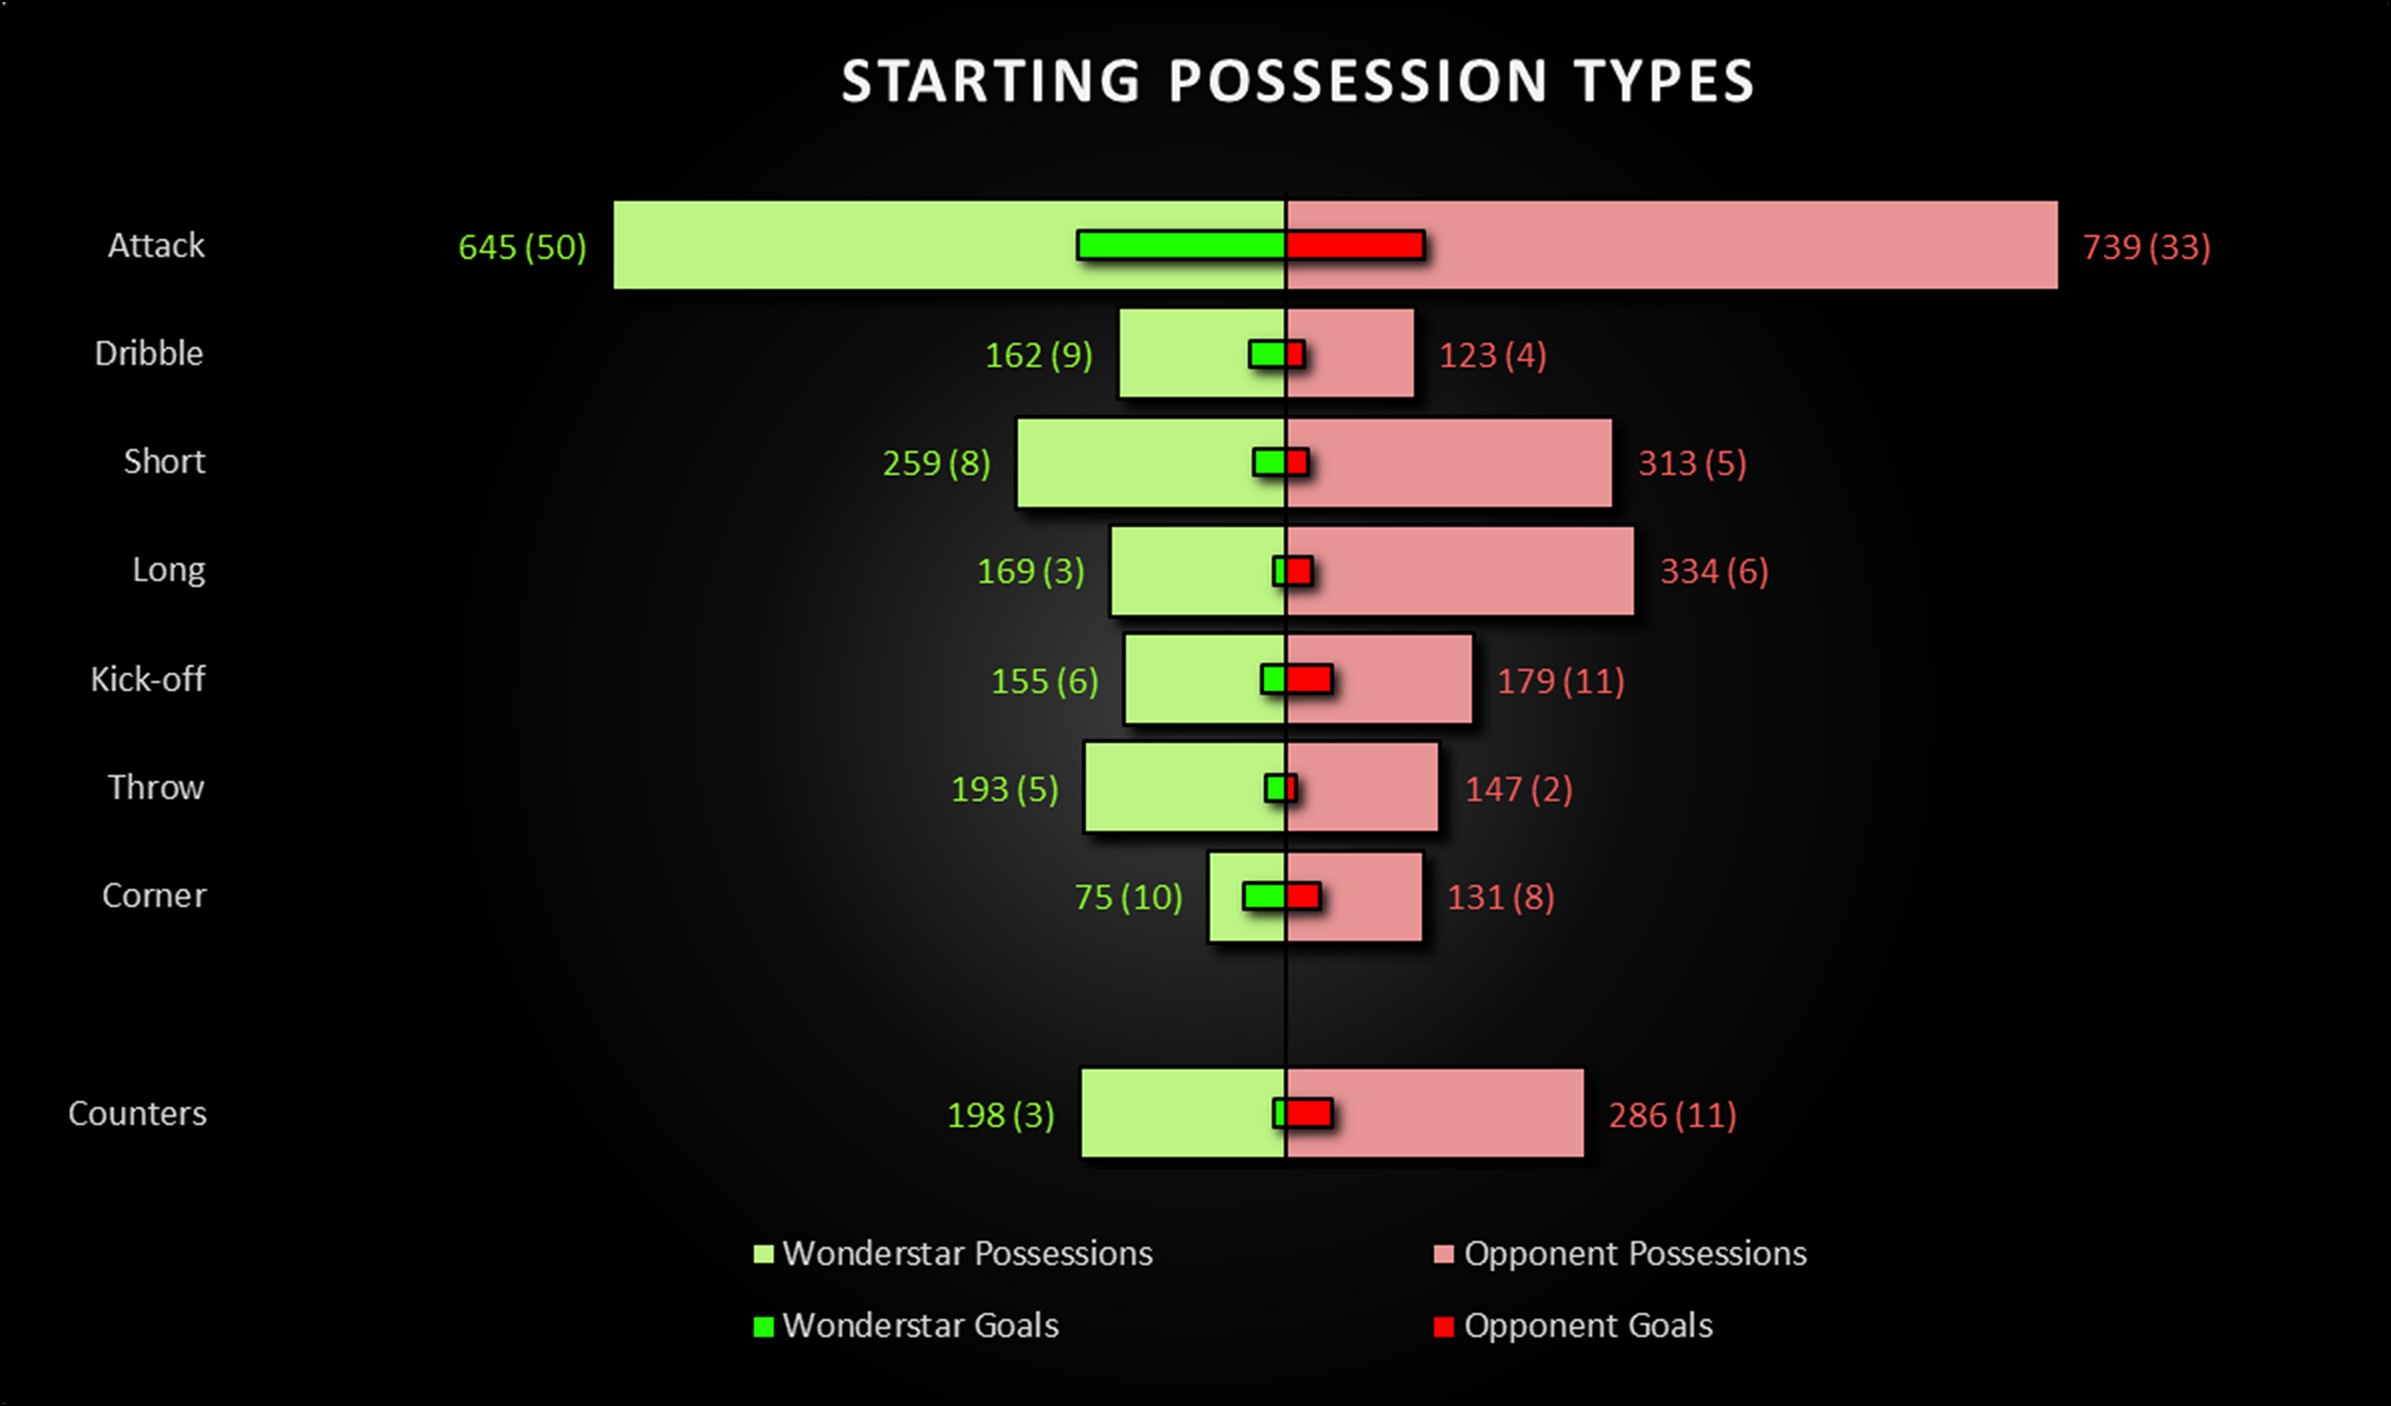
Big difference! First the positives - The Wonderstars were just as dangerous as their higher-quality opponents from counter-attacks (though they had fewer), corners, throw-ins and kick-offs. The negatives though were a poorer conversion rate from midfield possessions (Attacks), and a catstrophic rate of return from defensive positions (Short / Long). Worst of all, two reliable sources of goals from the previous season - dribbles and free-kicks - were almost totally stifled by better defenders. But nonetheless, they survived. As discussed earlier, The Wonderstars brought in a striker and shifted to a 4-4-2 attacking style for this season, with the following results: Figure 6: Passages of play sorted by team and possession type for matches involving The Wonderstars, Season 111 (64 matches).
Numbers indicate number of possessions over the whole season, with goals resulting from those possessions in parentheses.
I've been getting less possession this season - note for example that my opponents started almost 100 times more often than me with the ball in midfield, and about 200 times more often in defence. I've outscored my opponents this season, though, so where is the difference coming from?
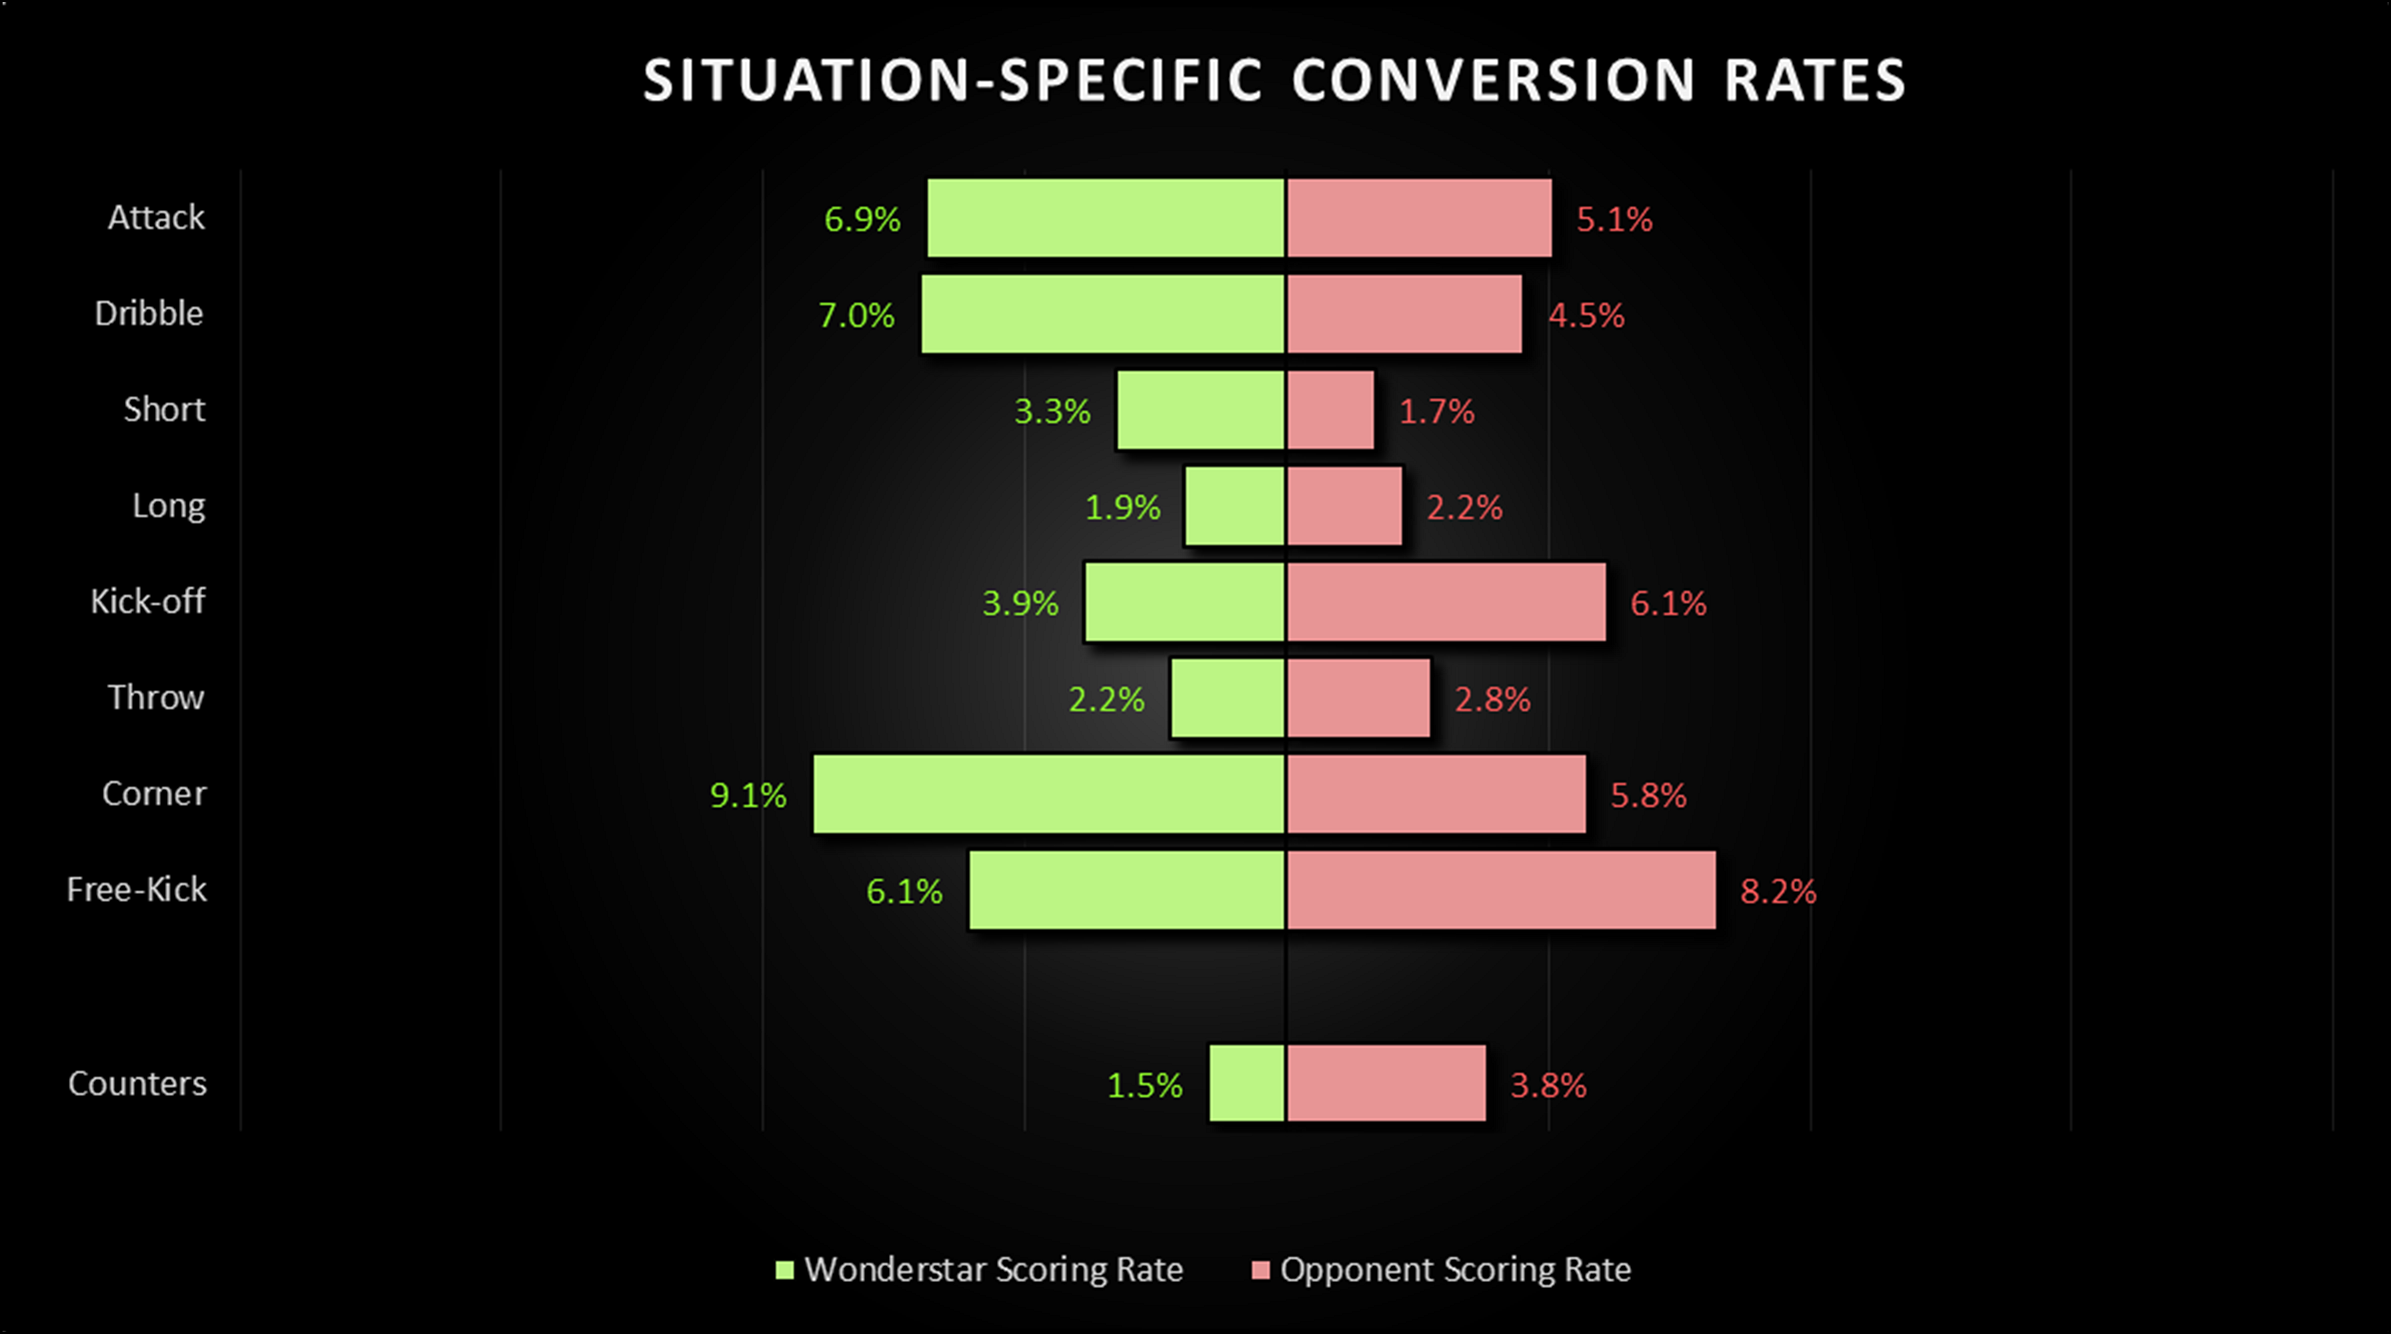
Figure 7: Chance of scoring from different match situations for The Wonderstars and their opponents, Season 111 (64 matches).
Generally speaking, there's an improvement across the board. But a few things stick out. I'm turning a respectable number of defensive possessions into goals now, and limiting my opponents much more when they get the ball in defence. But they also scored a bunch of times from kick-offs and throw-ins too, so overall we're pretty evenly matched when the ball starts in our own half - that's not what's deciding games most of the time. I was pretty vulnerable to the counter attack this year, conceding eleven goals that way (out of 83 total), and got fewer goals that way myself. So playing 4-4-2 and attacking more certainly has its drawbacks. But I made up for that with a big improvement in both my own attacks from midfield and in defending those of my opponent (perhaps improving attacking and defending teamstats might have helped here, as well as having that extra striker to aim for when passing or crossing). Plus my defending at corners is improving, and while I'm still vulnerable at free-kicks the difference is not as vast as it was last season. Teamstats ahoy! The really noticeable difference though is how much more effective my dribbling has been. My most frequent dribblers are defenders, with low shooting, so when they break through the defence they need to lay the ball off to a striker for me to score - if they have a shot themselves the result is usually pretty ugly. Having two strikers and an attacking pressure seems to mean that my defenders get support more often, and are able to make that key pass for the striker to finish the move. And in the offseason I'll get to work on those free kicks... Again, I hope this was enlightening or interesting for some of you, and feel free to ask questions or drop me some feedback in the comments below!
- Belizio
|
| Share on Facebook |
| This blogger owns the team The Wonderstars. (TEAM:154471) |
|
You are currently not logged into ManagerLeague If you wish to log in, click here. If you wish to sign up and join us, click here. |
|
 .
.

| MKManager79 wrote: 22:11 22/05 2014 |
|

| Belizio wrote: 22:16 22/05 2014 |
|

| ScuzBucket wrote: 16:04 28/07 2014 |
|
| Post a comment |
|
| © 2003-2007 Fifth Season AS, Oslo, Norway. Privacy Policy. Rules and Code of Conduct. Sitemap. Responsible Editor for ManagerLeague is Christian Lassem. |