| Wonderstar AnalyticsSee all entries in this blog |
Introducing Match Analytics (06/03/2014 04:45) |
"The simulator... is the single most important piece of the ML-puzzle." - Thales
Gaining attributes on your players sure is addictive, but I think we've covered that enough for a while. Let's switch our attention to what I think is ManagerLeague's biggest strength - the match engine. I'm going to introduce a fairly simple analysis, and describe how it's successfully guided my transition into a higher division. You should probably think of this less as a "Chronicles of Team X" type post, and more of an illustration of how you can use even quite broad statistics to adjust and improve your strategy. The first thing to remember is that for a game this complex, ManagerLeague gives us surprisingly few statistics. We get to see goals, assists and appearances for league games (plus some cup goals), alongside a simple average of player rating in league games. This doesn't really do more than scratch the surface when it comes to assessing how well our team is performing, or why. Quality Blindess (judging a player or team by the Q-value and ignoring performance, teamstats or other attributes) is pretty well-known, and avoided by most experienced managers, but that doesn't mean looking at performance ratings tells you the full story either. The more detail you look at, the better your competitive advantage. A crucial step towards becoming a better manager in this game, then, is being able to figure out how your team is performing from match reports. That's because the match engine works from the bottom-up. What I mean by that is that results emerge in a relatively realistic manner from dozens or hundreds of events during a game, and specific attributes on individual players (combined with your tactics, teamstats, opponents, luck and probably a few other factors) determine whether those events go in your favour and lead to goals or not. Reverse-engineering all that data and working out how to improve your side is a pretty open-ended challenge, but an interesting one I think. Thales' Blog is a really interesting and enlightening place to start if you want to peek a little bit into the mechanics of the game. I'd treat most of it as conjecture rather than stone-tablet-fact, but I feel like I came out of reading it with a better understanding of how to read match reports. The problem is, even if you learn to decipher from the match reports what's really going on under the surface, who the heck has time to read them all? Possession vs Conversion To solve this - and give myself a competitive edge - I've invested some time "up-front" automating the extraction of some key statistics from my match reports. This allows me to get an overview of how my team is performing in much more detail, without having to read through each report and try to spot trends over the course of a season.
As an example, in ManagerLeague a match is composed of passages of play, which each begin with one side in possession of the ball. Your possession - the proportion of times you begin with the ball - is a crucial factor in determining how many goals you score or concede, but this statistic isn't summarised for you (you'd have to go through each match report and count the number of times you started with the ball versus the times your opponent did). So, I wrote some leetcode to extract this possession statistic - ignoring kickoffs, i.e. only 'earned' possession given to you by the simulator. I also pulled out the number of goals I scored compared to my opponents, and calculated a "conversion rate", which is the percentage of posessions resulting in a goal. So, Goals = Possessions x Conversion rate. Teasing those two factors apart should give me a better idea of where to strengthen than I'd get just by looking at mean performance or goal difference, since those simple statistics only tell me how I'm performing, not why. So, averaging these across all my competitive games (including Player Cups) for season 109 gives me a nice visualisation of how my team compared against their opponents: 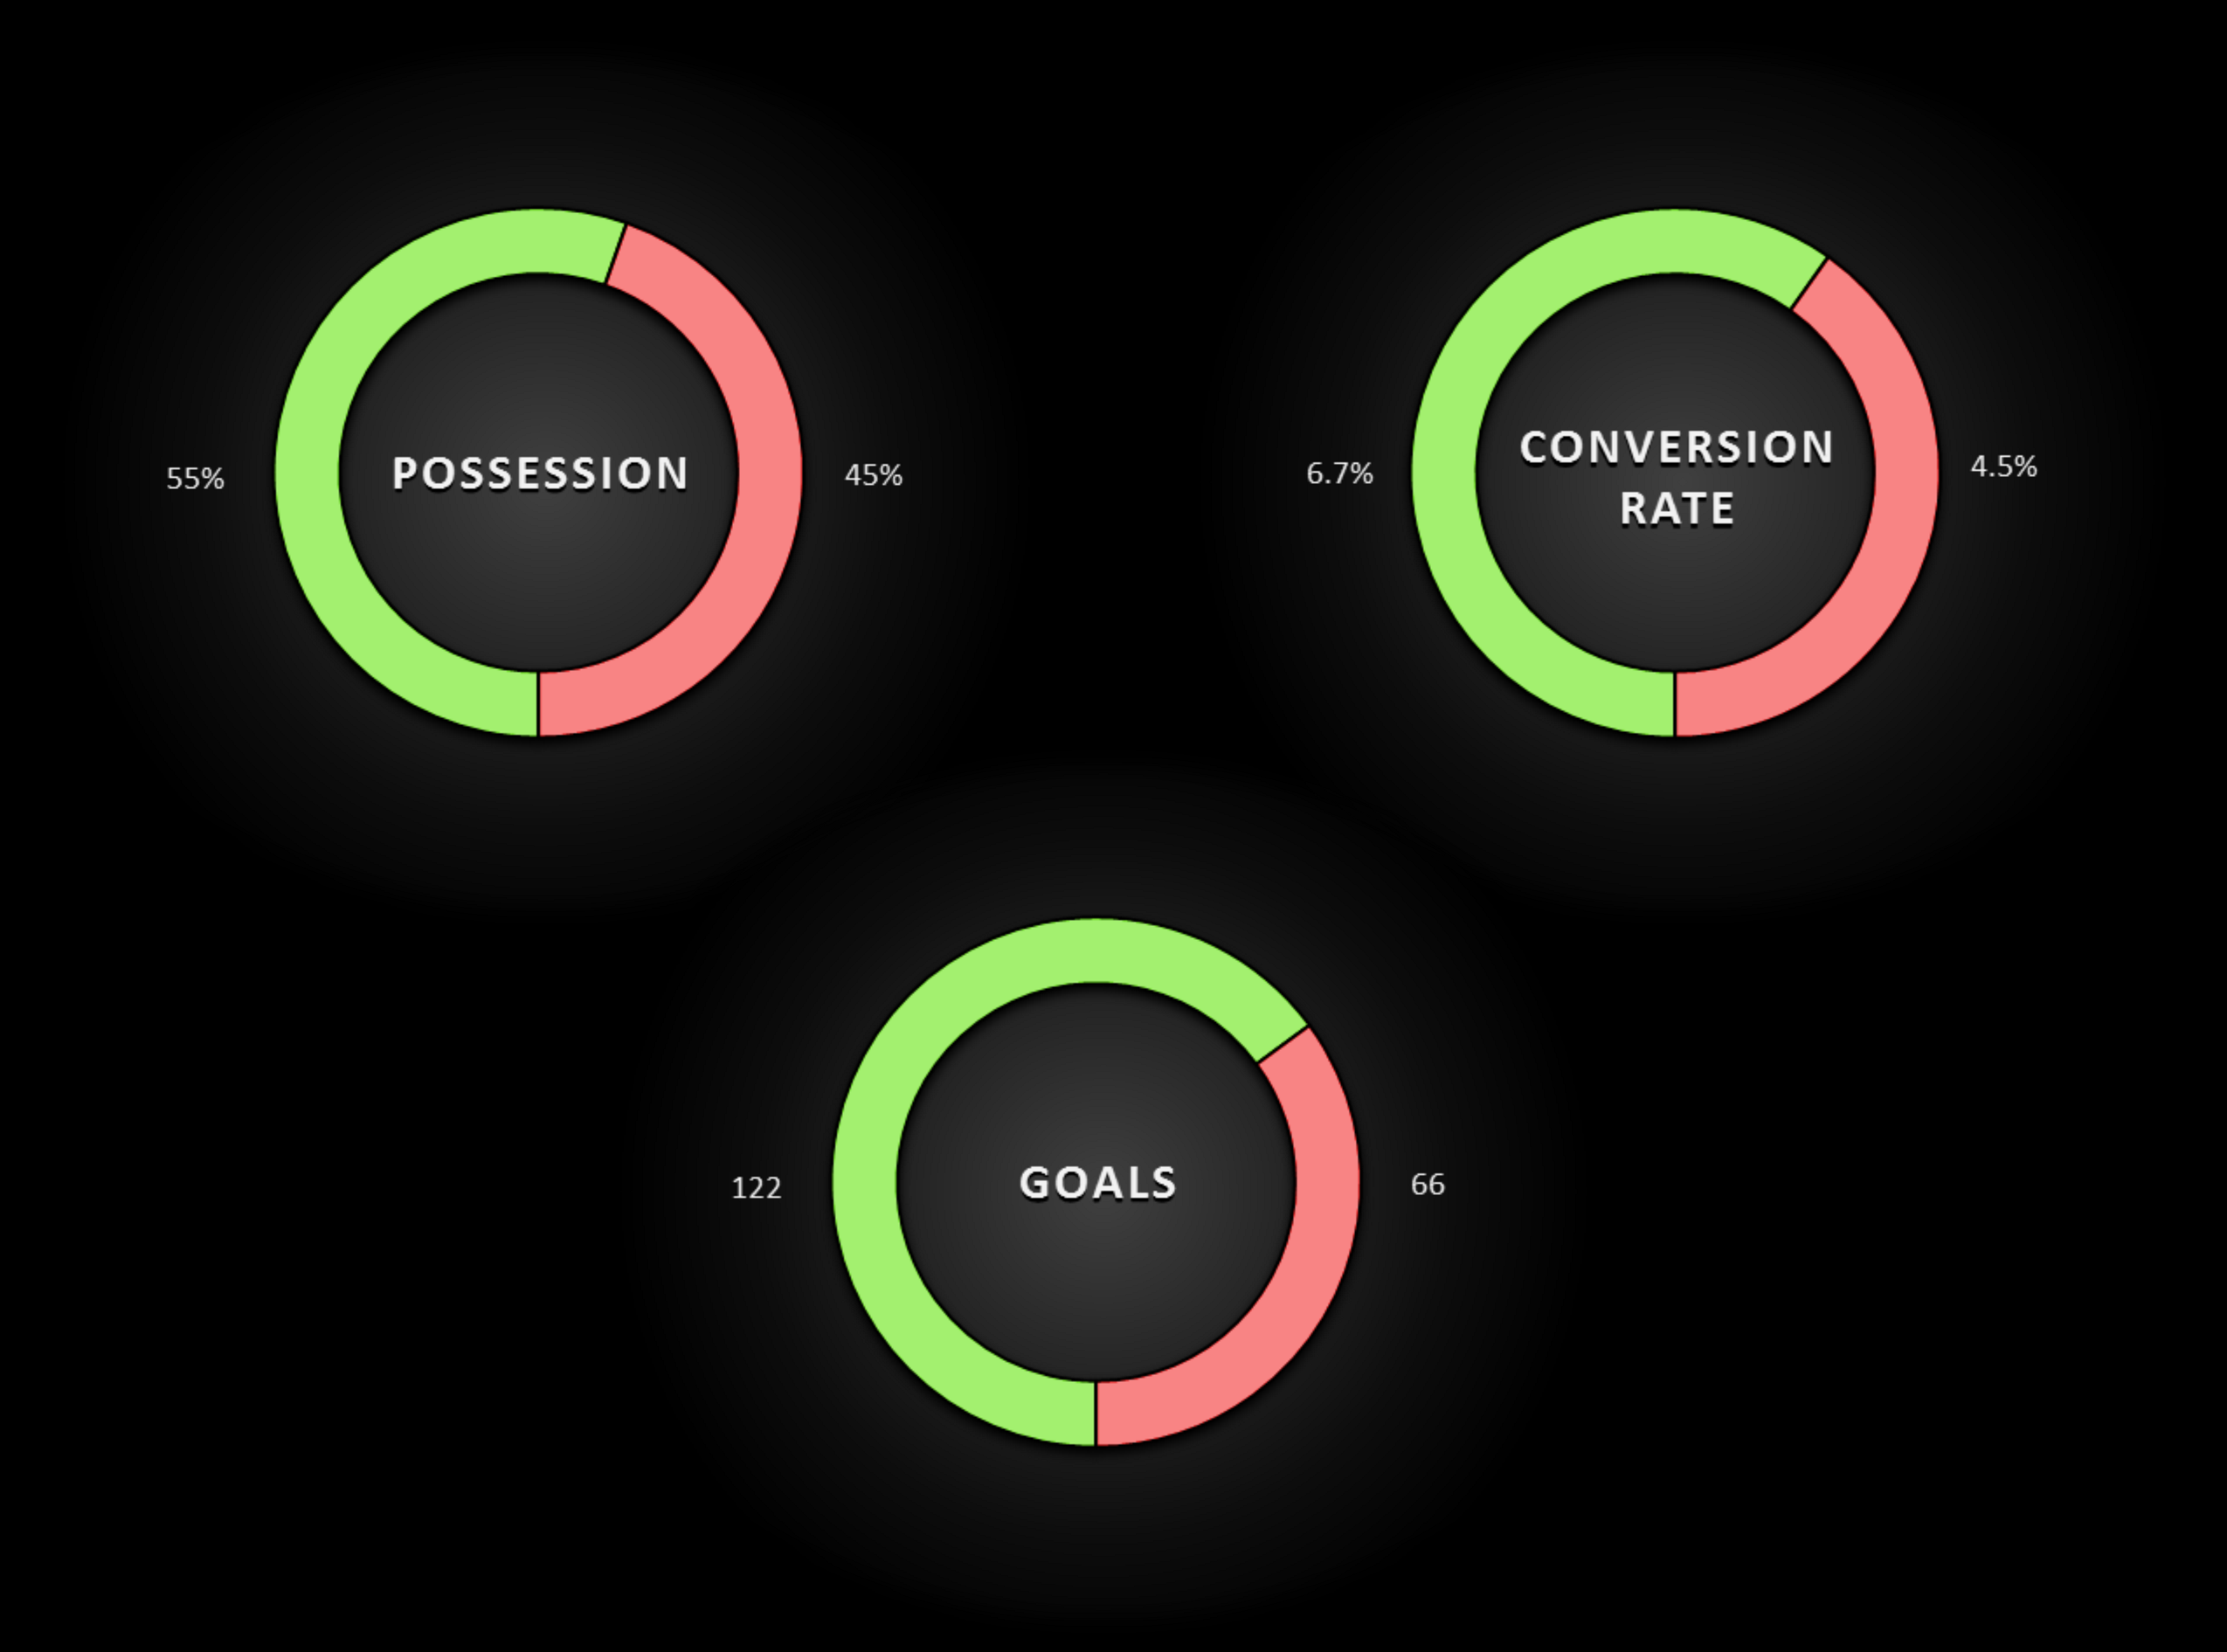 Key Statistics for The Wonderstars (67 matches), USA Division 4; Season 109
To recap, that's my average possession (proportion of plays I began with the ball), my conversion rate, and the resulting number of goals I scored represented by the green bars. My oponents numbers are in the red bars. This gives me a little more information than just my league goals or average league performance - plus I can include whichever games I like, not just league matches. Overall I can see at a glance that during Season 109 I had around 55% possession, but also made the most of it - scoring nearly twice as many goals as my opponents in the 67 competitive matches I played that season. It's not too much of a surprise that the Wonderstars outscored other teams that season, as I was busy getting promoted from a bot-dominated division, so my toughest matches were mainly in the league cup and player cups. What's interesting to me is how much the advantage came from the conversion rate, rather than the amount of possession. Now let's plug in my match reports from the following season, after I got promoted up to a considerably harder division:
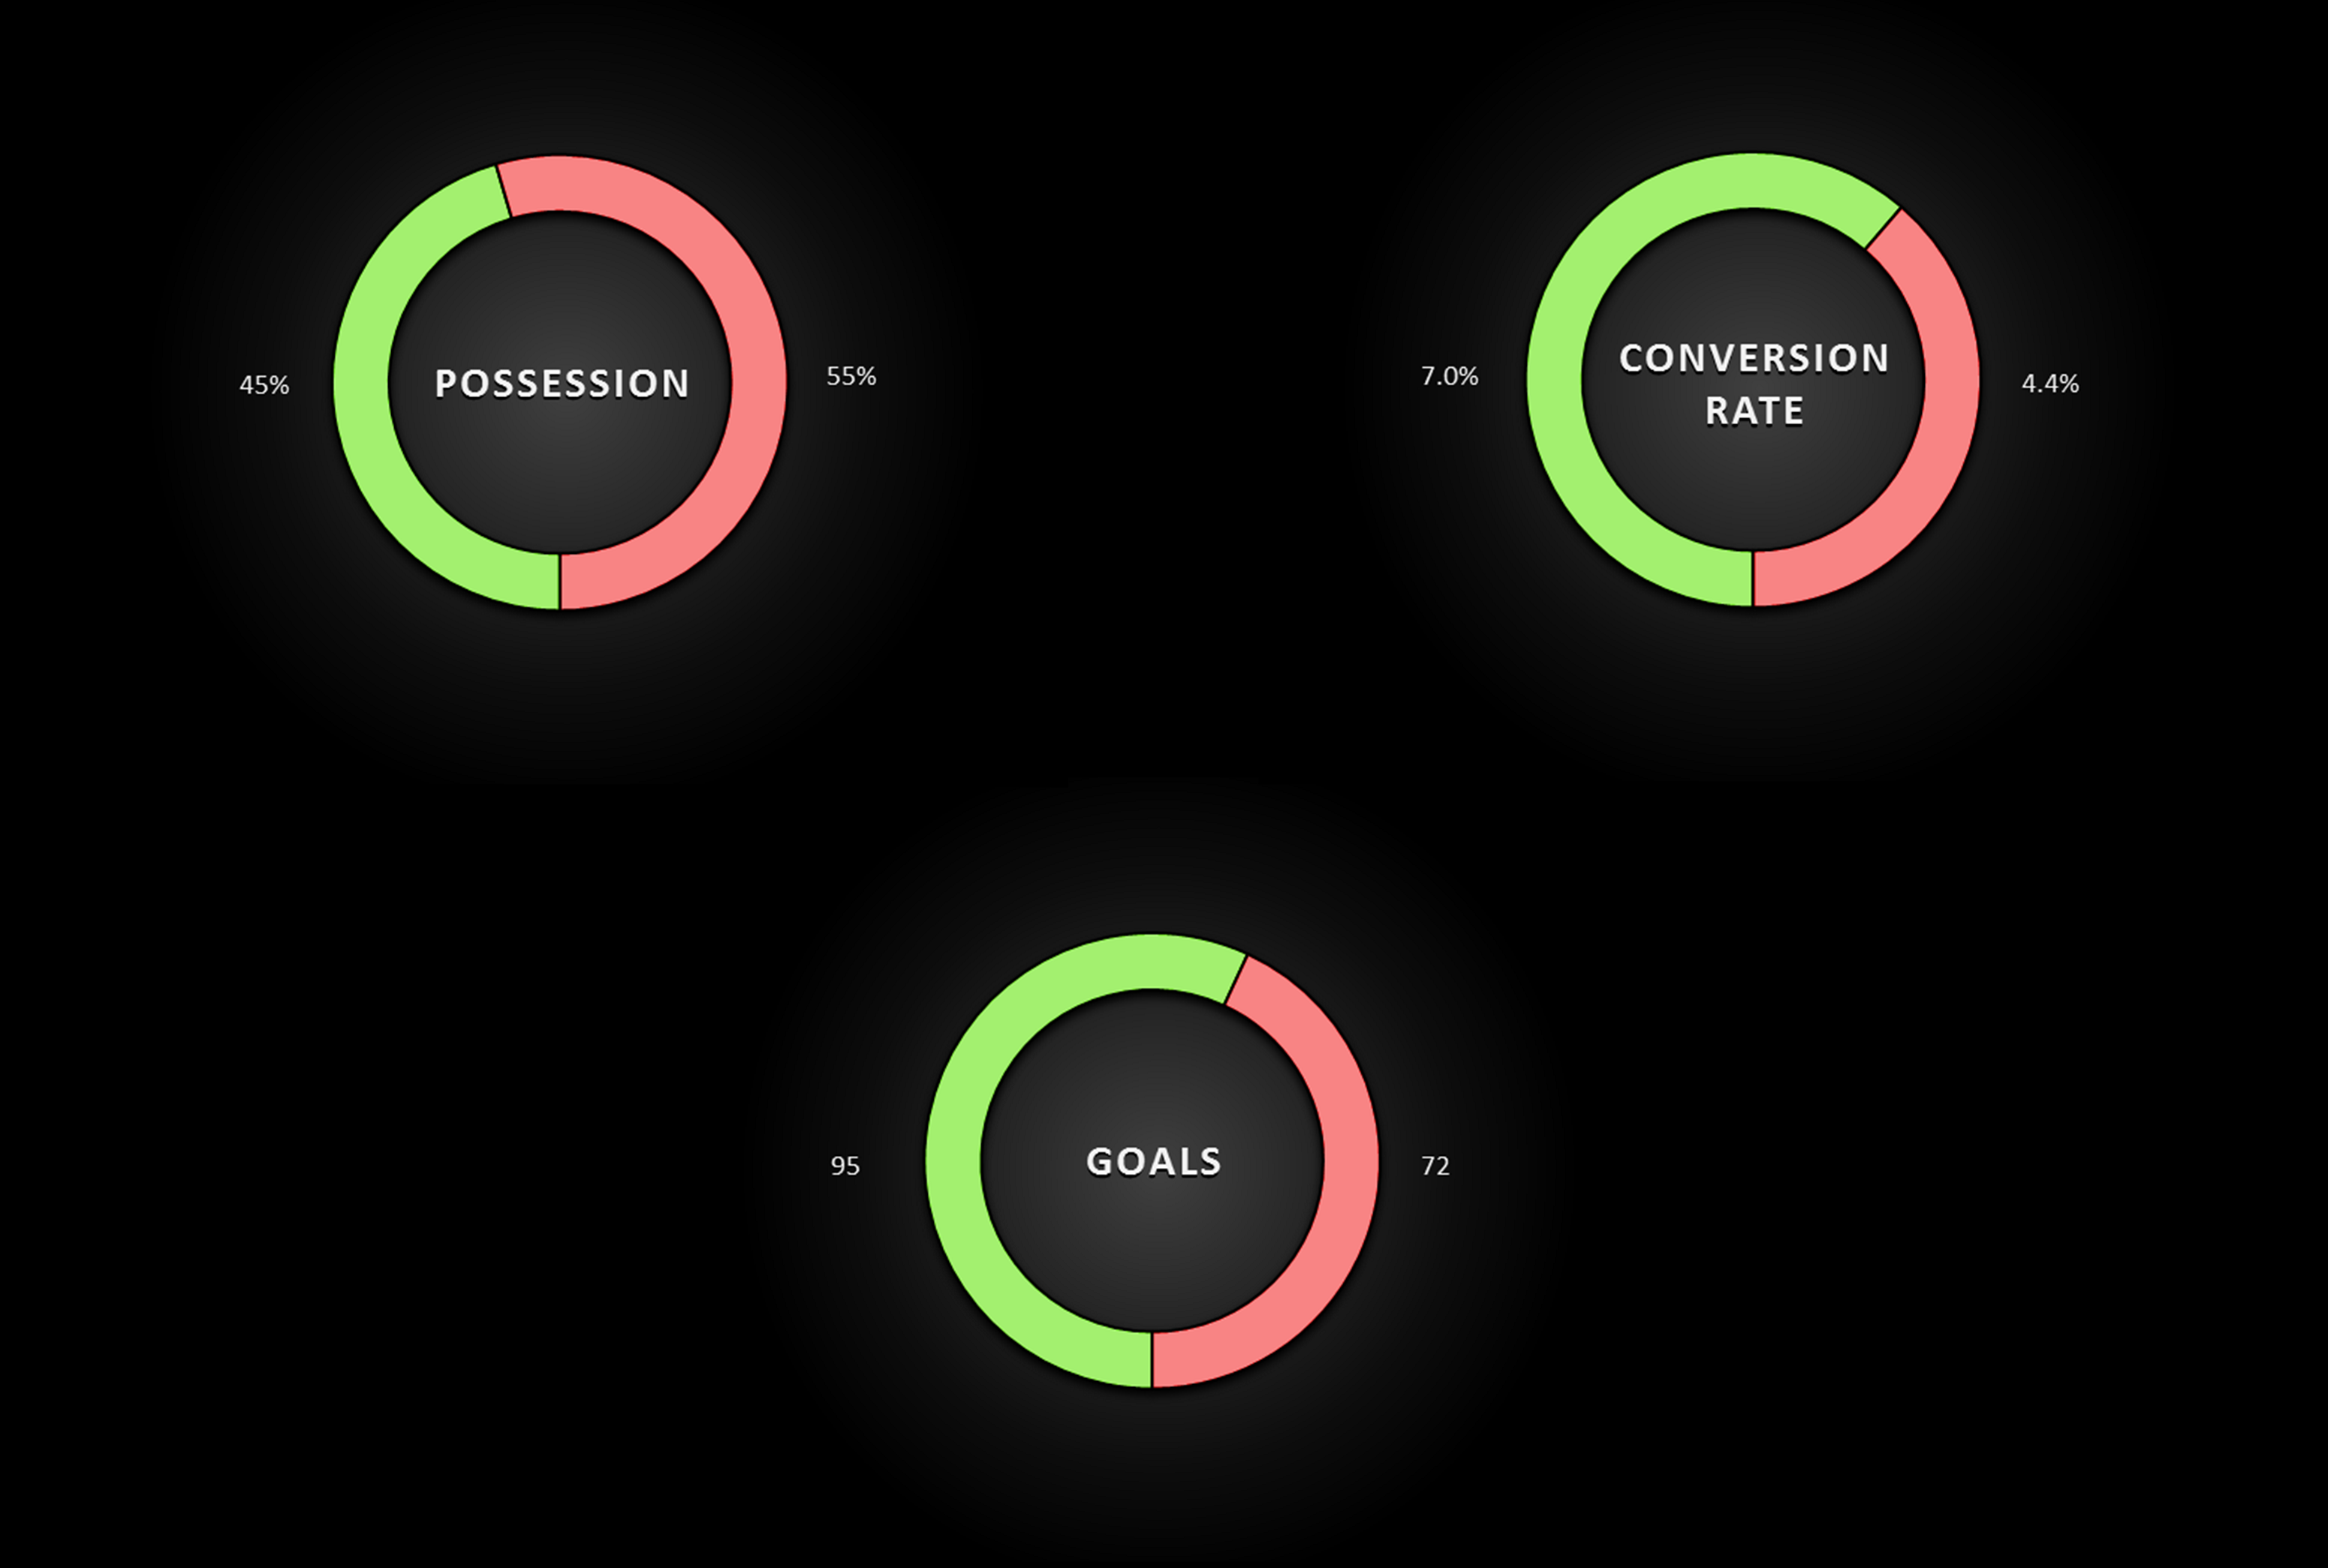
Key Statistics for The Wonderstars (66 matches), USA Division 3; Season 110
For season 110 I figured to survive I needed some experience, so I invested my transfer kitty in a veteran midfielder and an upgrade on my goalkeeper. The extra midfielder also allowed me to switch to a defensive 4-5-1 formation to keep things tighter against my superior opponents. I was pretty heavily outscored in the league, finishing with 40pts rather than the 78pts from the previous season, but I narrowly avoided the relegation playoff spots and outperformed my team quality so I called the season a success. What's interesting though is that I had just as much possession as my opponents did that season (perhaps even a few more once you account for the fact that I was getting the ball back every time I picked it out of my own net...). Presumably the increased experience in my squad, and especially in midfield, helped me here, but I'm guessing the biggest factor was my use of five midfielders in tougher league games. Where I was overmatched was in the conversion of these opportunities into goals. The previous season I converted 6.7% of my own possessions and conceded on only 4.5% of my opponents', but this pattern pretty much reversed in the tougher league. The new keeper obviously wasn't enough on his own to stop my opponents' higher calibre attackers from scoring, while my top scorer from Season 109 struggled to adapt as a lone striker and scored only a handful of goals. There were two big lessons I drew from this. First, despite having a lower team quality than most of my opponents, it didn't seem like I'd get too much benefit from continuing to play defensively - I get my fair share of the ball, so a tighter game would probably just lose me some points by increasing my draws at the expense of both wins and defeats. Notice, too, that my conversion rate decreased by more (-2.4%) than my opponents' rate increased (+1.6%). So while my new keeper hasn't turned out to be a world-beater, it made sense to persevere with him - and let my young defense continue to develop - and invest in my forward line instead. So, midway through the season I brought in a veteran striker, and though he fizzled a bit in that first year he postponed his retirement to come back for an extra season (I like to think he wanted to prove he wasn't just here for one last payday). My younger strikers had gained in quality and experience, so I also brought in a couple of young midfield prospects to boost my squad depth a bit, and returned from the season break with the same team, but a 4-4-2 formation and a more attacking mindset:
Key Statistics for The Wonderstars (58 matches), USA Division 3; Season 111
The results this season have completely turned around: With three games to go I'm 17pts clear of the relegation playoff spots, and not yet out of the running for an unlikely promotion playoff. I'm conceding 0.2 fewer goals a game now, but the big difference is that I'm scoring 0.6 a game more than last season - I'm 3rd in the department for goals scored, and my veteran striker has finally justified his wages with 33 goals from 51 appearances in all competitions. So why such a dramatic improvement with the same group of players? Is it just a generic quality improvement? Well, dividing the data up like this shows us pretty clearly that it isn't. First off, my quality remains a couple of points below the department average, ranking me 11th. But I'm 17 points and +38 goal difference clear of 11th place this season. The key stats show a completely different story to last season - instead of retaining the ball, I'm now only getting 45% possession, which can probably be put down to the shift from 4-5-1 to 4-4-2. I'm more than making up for that drop though with a huge increase in my conversion rate (+2.7%, i.e. 60% greater chance of scoring when I start with the ball), as well as a decent improvement in my ability to repel attacks (-1.7% opponent conversion rate). I've had a mild increase in quality this season relative to my opponents, especially in my youthful defence, but that's not where most of my improvement has come from - it's the change in system that's made me far more efficient. Bottom line:
I was able to improve my strategy using possession and conversion statistics from match reports.
All that comes from a pretty simple analysis (possession and conversion rates). I hope you found it interesting, and I'd love to hear your thoughts in the comments! In the next post I'll be delving a little deeper by looking in more detail at what I'm doing with that possession.
- Belizio
|
| Share on Facebook |
| This blogger owns the team The Wonderstars. (TEAM:154471) |
|
You are currently not logged into ManagerLeague If you wish to log in, click here. If you wish to sign up and join us, click here. |
|


| retired councillor wrote: 17:18 07/03 2014 |
|

| Belizio wrote: 20:26 07/03 2014 |
|

| Post a comment |
|
| © 2003-2007 Fifth Season AS, Oslo, Norway. Privacy Policy. Rules and Code of Conduct. Sitemap. Responsible Editor for ManagerLeague is Christian Lassem. |